Ghost errors in Chrome DevTools
I was recently presented with the following error in Chrome DevTools:
Uncaught SyntaxError: Unexpected token }Along with this being a very vague error, the link in DevTools that typically takes you to the script with the error instead took me to the first line of the HTML document where, of course, there's no JavaScript.
I did a bit of searching around and found this Stack Overflow post which suggests that it's not a syntax error in my JavaScript files, but something that's being generated or handled elsewhere.
To investigate further, I used the "Pause on exceptions" feature of DevTools's Sources tab, which immediately stops execution at the point of error, and highlights where in the stack and source code it currently is.
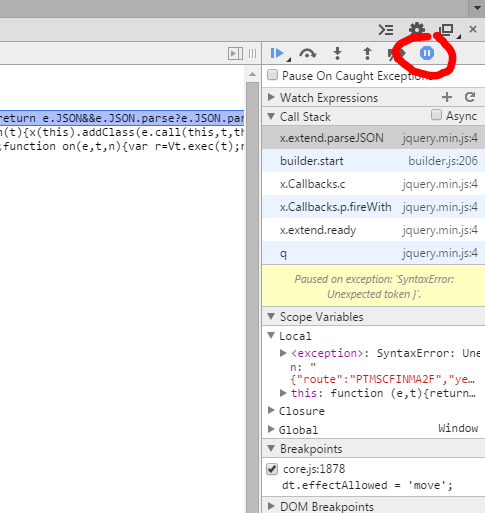
As can be seen in the attached picture, the error was occurring during
a call jQuery's parseJSON function from by own
builder.start. This led me to find that
builder.start was trying to parse some JSON from a data
attribute which had been malformed ({supervisor:}).
Fixing that JSON speedily removed the syntax error.
So if you come across this sort of "ghost" error, it might be a problem with your JSON. More importantly, try using DevTool's Pause on exceptions to try and get to the bottom of it.
Other browsers
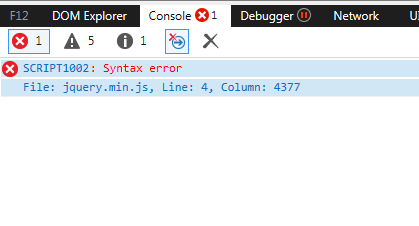
After fixing the problem, I recreated it to see how other browsers' developer tools would handle it. Internet Explorer fairs slightly better than Chrome, at least narrowing down the error to the jQuery file. The trace link just takes you to the last line of the file though.
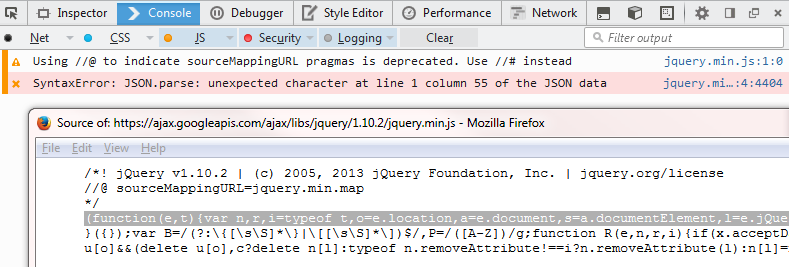
Firefox is more helpful, noting directly the function in the call stack at the time the error occurred and the position in the JSON where the parsing failed. The trace link is also much more accurate but, because Firefox Developer Tools don't handle JavaScript files very well yet, clicking through to the minified file is only accurate to the line.